 It’s T-SQL Tuesday again, and this month’s gracious host is Mike Fal (Blog | Twitter), urging us to deliver wonderful stories about SQL Server trick shots. The first thing that comes to mind is the Yo Gabba Gabba “Cool Tricks†segment. You should probably read the rest of my post before watching the video, or you’re liable to end up watching Flight of the Conchords shorts for the next twenty minutes.
My trick shot is nothing particularly revolutionary, but my hope is that at least one person hasn’t seen this trick before. I’ve used it often enough that I’ve got it down to a fine art.
The trick is using SQL Server Profiler to discover the inner workings of SQL Server Management Studio. Almost everyone knows about the “Script†button at the top of most dialog boxes to generate the T-SQL commands to perform a specific action, but occasionally you want to see exactly how SSMS came up with something it is displaying on screen. There’s nothing particularly special about SSMS – it doesn’t appear to interface with SQL Server in any way other than you or I could, using primarily T-SQL commands, with a bit of SMO thrown in. This generally means that anything you can see or do with SSMS, there will be an equivalent, and you can capture this activity.
The trick in action
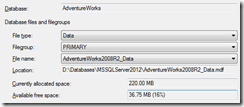
For example, one of my preferred methods to see how much space is available in a file is to use the Shrink File dialog (right click the database in Object Explorer, Tasks, Shrink, Files).
There’s 220 MB allocated, and 36.75 MB available. That could be a very useful thing to know, and to use in my own set of diagnostic queries. How does SSMS determine this? Time to bring out the trick shot.
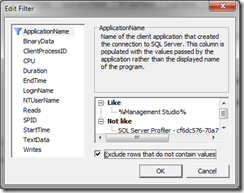
Fire up SQL Server Profiler from the Tools menu, and connect to a non-production machine. You can keep all the default events, but the important part is the filter. If you’re on a machine by yourself, a simple filter on Application Name (like ‘%Management Studio%’) is sufficient, but you can add extra filters for your login name if necessary.
Once the trace is running, do the smallest amount of steps necessary to trigger what you want to capture, clearing the trace window if need be. For example, right clicking on a database in the Object Explorer causes 39 lines worth of activity to appear. The smallest amount would be to get into the Shrink File dialog, then change the drop down lists to choose which file you want to display. The fewer rows to wade through, the easier it will be to find that T-SQL you’re looking for. In our case:
exec sp_executesql N'use [AdventureWorks];select
CAST(CASE s.type WHEN 2 THEN s.size * CONVERT(float,8) ELSE dfs.allocated_extent_page_count*convert(float,8) END AS float) AS [UsedSpace],
CASE s.type WHEN 2 THEN 0 ELSE @_msparam_0 - dfs.allocated_extent_page_count*convert(float,8) END AS [AvailableSpace]
from
sys.filegroups AS g
inner join sys.database_files AS s on ((s.type = 2 or s.type = 0) and (s.drop_lsn IS NULL)) AND (s.data_space_id=g.data_space_id)
left outer join sys.dm_db_file_space_usage as dfs ON dfs.database_id = db_id() AND dfs.file_id = s.file_id
where
s.name = @_msparam_1 and g.data_space_id = @_msparam_2
',N'@_msparam_0 nvarchar(4000),@_msparam_1 nvarchar(4000),@_msparam_2 nvarchar(4000)',@_msparam_0=N'225280',@_msparam_1=N'AdventureWorks2008R2_Data',@_msparam_2=N'1'
This returns a UsedSpace of 187648 KB (183.25 MB), and AvailableSpace of 37632 KB (36.75 MB), the sum of which is the 220 MB shown above. We’ve managed to discover that SSMS uses sys.dm_db_file_space_usage to determine free space.
What have I learned here?
I’ve learned many things in the past using this trick, but the most recent was while writing up this post, which was done using SQL Server 2012 (with an upgraded 2008 R2 AdventureWorks database). I originally tested using SSMS 2008 R2, connecting to a 2008 instance, and those tests showed that SSMS was actually using the FILEPROPERTY function to get the space used, with code similar to:
SELECT FILEPROPERTY('AdventureWorks2008R2_Data', 'SpaceUsed') * CONVERT(float, 8)
When I ran the test again to write it up, I was a little surprised to see sys.dm_db_file_space_usage appear. This has been available since SQL Server 2005, but this part of SSMS just hadn’t been updated to take advantage of the DMVs until now.
Parting words
There you have it – if you see any interesting value come out of SSMS, use Profiler to see exactly how they did it, and you can learn from it.
My name’s Jim, and my cool trick is using my Profiler x-ray glasses (go watch the video now).


[...] [...]
[...] I’m curious about where to find information. My former colleague Jim McLeod (@Jim_McLeod) blogged about this a few months ago, with an example that I remember looking through with him four or five years ago. It’s a great [...]